
We’ve all done it before…
At some point in our lives, whether it’s related to marketing or something else, we’ve lied to ourselves.
It’s natural to want to feel good, and the brain can distort truths to make you feel that way.
But lies get in the way of progress.
They can make you feel okay about not putting in the effort required for success.
The scariest part is that sometimes we don’t even know we’re doing it.
The cause of this, when it comes to marketing and business, is using metrics incorrectly.
Metrics are very important because they allow us to quantify our results.
However, not all metrics are useful, and some might be useful but are hard to interpret.
A very realistic and common scenario involves marketers believing that they are doing a great job (based on the metrics they track) when in reality, they aren’t producing much.
Other times, metrics might seem to suggest that you should change your marketing tactics and strategies. However, it might be that you are misinterpreting the meaning of those metrics, and then you make a change that actually makes your work less effective.
Any of these scenarios will diminish your chances of achieving the success you want so much.
And that’s why it’s crucial that you understand the ins and outs of metrics, which is exactly what I’m going to show you here.
After this post, you should know 5 different ways in which metrics can deceive you and how to protect yourself from that in the future.
1. Page views and emails do not equal sales
This first aspect of metrics is the most important.
Basically, there are two types of metrics:
- vanity metrics
- useful metrics
Care to guess what each means?
Vanity metrics sound nice but don’t mean much.

For example, a search engine could be reporting 1,000,000 searches per month.
But that could mean many things. Most importantly:
- you could have one really enthusiastic searcher
- you could have 1,000,000 single searchers
- you could be getting this many searches because the searcher couldn’t find the right result
It’s not that vanity metrics are necessarily bad; it’s just that they don’t tell you anything clearly or accurately.
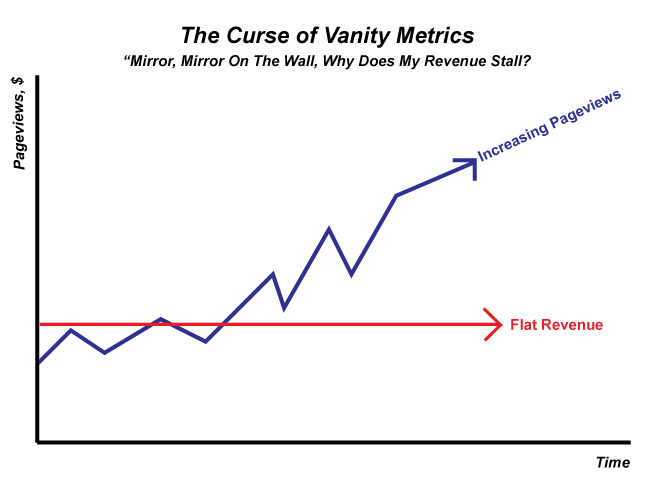
Traffic is one of the most commonly used metrics for content marketers, and relying on it is a mistake.
Traffic is a vanity metric.
You could buy a million pageviews tomorrow from some low quality ad network and get absolutely nothing from them.
While quality pageviews would be a decent metric, it’s very tough to measure something like that.
The same goes for the rate of opened emails or the number of email subscribers on your list.
I’ve seen some businesses make nearly zero revenue from a list of thousands of subscribers while others make thousands from a list of only a few hundred.
If you’re measuring email list growth, it doesn’t tell you a damn thing about how your business or marketing is performing.
This goes for all vanity metrics.
You can always find a few metrics in Google Analytics that are increasing every month. Don’t fool yourself into thinking that everything is running perfectly–it might not be.
What makes a metric “useful”? The simplest way to recognize “useful” (sometimes called “smart”) metrics is to look for the 3 “A’s”:
- Actionable
- Accessible
- Auditable
This concept comes from the lean startup but can be easily applied to just about any business.
Let’s break down the signs of useful metrics one by one, starting with how to determine whether a metric is actionable…
As you might have guessed, actionable metrics allow you to take action based on the information they provide. And I am not talking about just any action, but one that actually improves your work.
The second “A” is for accessible. This matters most if you work in a team.
The idea is that if you decide on a key metric for a business, you want everyone in that business to understand what it is. More than that, they need to know how to find it, understand it, and use it.
Certain metrics can make sense to technical team members, but maybe not marketing or sales. A good metric should be easily understood by all.
The last A stands for auditable.
This relates to the concept of accessible, and it means that any person on your team should be able to access any data in your business (related to the metric) and create a report with it.
If it can be tracked with Google Analytics, your problem is solved since all team members can easily be added to your website’s account. They can look up metrics and export reports as needed.
The goal comes before the metric: It’s important to remember why we need metrics in the first place.
Metrics allow us to measure things.
And useful metrics measure the things that show whether your marketing is producing acceptable growth or not.
To find these metrics, you need to start with your main marketing or business goals.
Here are a few common ones that you might have:
- Make a profit (it may be a certain amount)
- Have a significant positive impact on your customers’ lives
- Do meaningful work
It usually doesn’t get much more complicated than that.
For each goal, you want to try to determine metrics that show whether you’re succeeding or not.
Let’s look at a few example metrics.
Goal: Make a profit
Possible metrics: revenue, profit, costs of goods sold, current members, monthly churn (customers lost), retention rate, new customers, customers lost (if applicable).
Since most businesses want to maximize their profits, or at least revenue, these metrics are usually the most important ones to track.
Usually, you’ll pick 1-4 of them to track regularly.
Every time when you or anyone on your team does something, it should, in some way, improve at least one of your chosen metrics.
Some of these metrics depend on your type of business. Things like retention rate and churn apply only to recurring revenue businesses (e.g., subscription boxes).
You want to keep your choices as simple as possible.
If your main goal is profit, track profit first and foremost.
For some parts of your marketing, you won’t be able to track profits directly.
That’s why you want other, related, metrics that could tell you when something’s not going right in your business.
For example, if you all of a sudden see a spike in the number of customers you lost, you can use that information to take action and figure out which recent change caused the loss.
Let’s look at one more goal…
Goal: Have a positive impact
Possible metrics: average time on page, customer survey satisfaction scores, percent of return visitors.
Many goals are qualitative, which, of course, makes them difficult to measure.
And while you won’t be able to find a perfect “impact” metric, you can find others that can guide you.
In this case, it’s really difficult to find out how much customers are loving your products.
You’ll hear from those who had either a really great or bad experience but not from the “average” customer. Doing surveys is usually the best option you have, but you will always have a bit of a sampling issue.
If your product is an online product, like a course or SAAS, it’s much easier to measure a metric like this. You can usually just look at how often your users return to your site or tool.
Some goals correspond to more metrics than others. As long as a metric gives you unique, actionable information, it’s worth tracking.
Finally, you could come up with a way to regularly evaluate how satisfied you are with the work you’ve been doing, but that’s another tricky one to measure.
Some goals, particularly qualitative ones, don’t need to be tracked through metrics (do reviews on a regular basis). Otherwise, make sure that any metric you focus on fit the “3 A’s”.
2. Metrics alone don’t always tell you the whole picture
You should always have justification for any action you take or conclusion you make.
If you are saying that your marketing is working well, you’d better have the metrics to back it up.
Most marketers understand this, which is a good thing.
However, many don’t back up their conclusions correctly. The most common error I see is that marketers back up their conclusions with metrics that don’t tell the whole picture.
Let me give you an example.
Say we have a marketer named Joe.
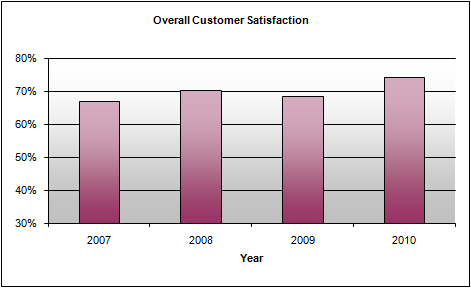
He tracks customer satisfaction as a metric. He observes that customer satisfaction went up last month and concludes that the business continues to grow as a result of the content he created.
Do you see the issue with concluding this based on this metric alone?
Joe’s boss, let’s call him Neil, isn’t quite convinced.
Neil digs into the business’s data and finds its customer retention rates. As it turns out, the retention rate went down, meaning that the business lost more customers than usual.
Putting these two metrics together reveals a very different picture:
The average customer satisfaction likely went up because many unsatisfied customers left the business.
That’s a serious problem.
This is why you need to ensure that the metrics you rely on don’t mask potential problems.
Selecting metrics that show you the whole picture: It’s never good to rely on a single metric to make a decision (in most situations) because they rarely give the whole picture on their own.
At the same time, you don’t want to have 15 different metrics–it’ll make it hard to draw a clear conclusion.
Instead, aim to have as few metrics–that give you actionable, accurate information–as possible, and base your decisions on those.
Scenario: You’re trying to assess the effectiveness of your current content marketing strategy.
In order to do that, we’ll need more than a single metric.
For reasons I went over earlier, traffic and email subscribers aren’t the best metrics here (although they may be the only choice for young blogs).
Instead, I’d rather focus on either qualified leads or actual sales if possible.
A qualified lead is different for every business. For example, it might be a webinar participant.

Someone who signs up and attends a webinar is obviously interested in the topics you cover and is likely a potential customer. This is enough to make them “qualified.”
This metric is useful because the more attendees you have, the more sales you should make. Unlike traffic, where more doesn’t always mean better, qualified leads correlate well with sales.
Therefore, our first metric is the “# of webinar attendees.”
But that’s not enough. It doesn’t tell us the whole picture.
The number of webinar attendees could be going up, but that doesn’t mean that the content marketing is succeeding.
Instead, it’s possible that most of those results are from your past work, unrelated to your current content marketing strategy.
Or it’s possible that you’ve learned to promote webinars more effectively through other channels than just content.
So, we need additional metrics.
The first one is to divide your webinar signups by source. You want to see which piece of content each signup initially landed on.
The ones that come from your recent content will tell you whether your current strategy is actually producing results.
Once you have this data over at least a few months, it will be clear which content is driving your visitors through your sales funnel.
What about your promotional tactics?
You need some sort of a metric that standardizes your signups. After all, if you create a new pop-up that is twice as effective as your old opt-in, that doesn’t mean that your new content is twice as effective.
Therefore, your final metric in this set needs to be a scaling metric.
Before you fully implement a new tactic to get more webinar signups, you need to split test it against the old one.
Once you have a sufficient sample size, you’ll have results that’ll look like this:
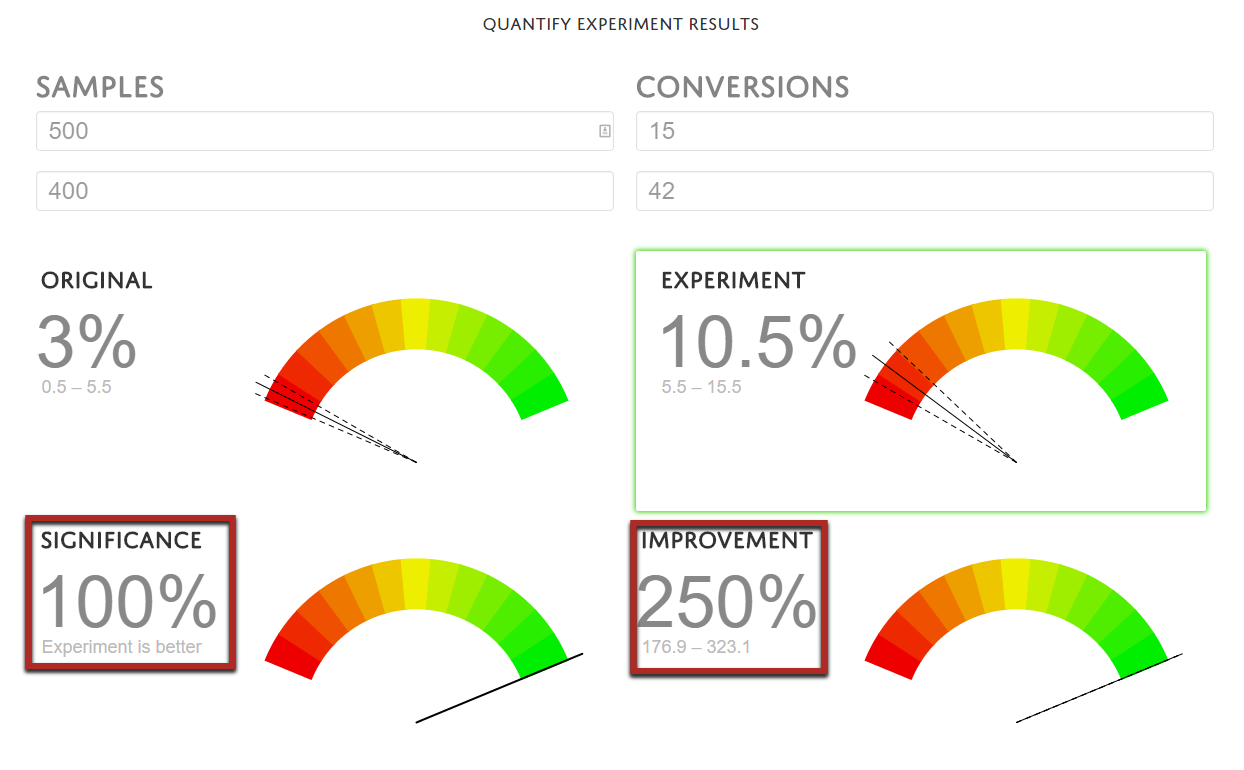
Based on these results, with almost 100% certainty, we can tell that the new tactic is better.
However, the improvement has a range from 177% to 323%.
Ideally, keep running the test until you have a tighter range, but the average number is usually the best choice.
Overall, you have a few options:
- take the worst case scenario (only improved by 177%)
- take the average (250%)
- take the best case scenario (improved by 323%)
You could also take a combination.
Based on each of these, you get a scaling factor by dividing these numbers by 100 (to convert from percent to decimal):
- 177% becomes 1.7
- 250% becomes 2.5
- 323% becomes 3.23
Then, you need to multiply the number of webinar leads you had in the past by the number you chose.
For example, pretend that these are your original results and that you implemented the new and more effective tactic in April:
| Feb | March | Apr | May | |
| Webinar leads | 100 | 120 | 325 | 360 |
| After 2.5x adjustment | 250 | 300 | 325 | 360 |
Notice that you adjust the values for the months that used the old, ineffective method by multiplying them by the scaling factor.
Now you can make a fair comparison.
In this case, with a 2.5x adjustment, it shows that there is steady growth in the number of webinar leads.
After considering all possible factors that could skew our original metric, we now have a set of metrics that we can use to determine whether our hypothetical content marketing strategy is effective or not:
- number of webinar leads (original metric)
- webinar leads by source
- scaling factor based on promotional methods (could be more than one)
How to come up with your own sets of metrics: I understand that this isn’t the easiest thing to do, but it will get easier with practice.
To simplify things, let’s break this process down into a procedure.
Take it step by step, and it won’t be very difficult.
- Clarify what you’re trying to determine (a goal of sorts).
- Determine your primary metric, the most important one directly related to your goal.
- Brainstorm possible situations in which your primary metric could be positive but not actually indicative of the results (like content marketing not improving even if webinar leads increased).
- Come up with at least one metric that will help you determine whether those situations happened (they are essentially safeguards).
- Write down your final set of metrics, and monitor it on a continuous basis.
Now, when you need to make a decision or draw a conclusion based on your metrics, you can be confident that it’s the right one.
3. You can’t measure everything
Some things are easy to measure…
But others are extremely difficult.
As a general rule, quantitative things, like the number of customers, views, or dollars, are going to be straightforward to measure.
But what about qualitative things like customer satisfaction? Or if you want to measure how much of an impact your content is making?
You can’t just go into Google Analytics and find a metric called “customer satisfaction.”
So, what do you do?
Your only choice is to find the best metrics that represent those things you are trying to quantify somehow. It’s not perfect, but it gives you something concrete to base your decisions on.
Finding the next best thing: We’ve already looked at this to some extent. When you can’t measure something directly, you find other metrics that measure things that correspond with your main concern.
For example, you might not be able to measure sales directly. Or sales may not occur for an extended time, and you want to make sure you’re on track.
So, you measure the next best thing: qualified leads.
These could be webinar attendees like I mentioned earlier, or they could be email subscribers.
You need to be careful with this because they need to be qualified leads. A random email address or one that you get because the user just wants a free bonus is not qualified.
However, if they request a demo or opt in without any bonus, they are likely potential customers.
The reason why this distinction is so important is because qualified leads will correspond to revenue. The more qualified leads you have, the more you will make in a fairly linear fashion.

However, unqualified leads may or may not correspond with revenue. It’s really difficult to determine how much more money, if any, additional leads will make you.
The takeaway here is to find a metric that corresponds closely with your goal.
This applies to both quantitative (like revenue) and qualitative aspects.
Consider customer satisfaction. What metrics are related to it? Here are a few possibilities:
- results from surveys given to customers
- return customer rate
- complaint rate or number of complaints
None of these are perfect solutions, but if you combine them, you’ll get a pretty good idea whether your customers are happy or not.
Beware of sample bias: One of the biggest issues with this type of approach is that you have a sample bias.
For example, customers who’ve had a very negative or very positive experience are the most likely to fill out your surveys.
And while it’s good to hear from them, you also want to hear from the rest of your customers. Your “average” customer is arguably the most important one.
You’ll get a sample bias with many metrics that describe qualitative aspects of your business.
Take your return customer rate.
If a customer buys something else from you, they’re probably pretty happy. Then again, just because someone doesn’t buy from you doesn’t mean that they are not happy.
Additionally, someone might not be very satisfied but still buy again from you because of some other reason like price or lack of other options.
What does this mean for you?
It means that none of these metrics are perfect. Taking multiple factors into account will help give you a more accurate picture, but even that’s not enough.
The only effective way of dealing with this is to understand the sampling biases you have.
For example, when it comes to survey results, put the most weight on the ones that aren’t especially negative or positive. Each of these likely represents several other customers that didn’t fill out a survey.
Likewise, put less weight on the extremely positive or negative surveys because you hear from a much larger proportion of these types of customers.
Think about the potential issues you might have with your samples, and put more emphasis on those areas that don’t provide you with much information.
4. Metrics can be manipulated, so make sure you know how you track them
Judging work performance using metrics can be a very dangerous thing to do.
The clearest example of this can be found in fast food restaurants and retail stores.
Managers and employees are told to meet certain quotas, e.g., food delivery times or number of sales, or else they risk being penalized or even fired.
When you take that approach, you shouldn’t be shocked to find out that employees are willing to manipulate metrics however they can.
They will start timers late or create fake accounts (to be cancelled later) to meet those quotas (yes, those kinds of things happen).
And while you may not take that approach with your team, maybe you give out raises, promotions, or something else to those who meet a certain performance metric.
Metrics are thought to be a way to track employee performance.
But they are often easily manipulated.
The good news is that if you chose “useful” metrics (from part 1), you are tracking metrics that are harder to manipulate.
But consider vanity metrics such as social shares or traffic.
If you told a writer or social media manager to get a certain number of social shares on each post, many would simply create fake Twitter accounts and schedule them to share each post 10+ times each.
Of course, this wouldn’t lead to real traffic for you, but it looks good on their metrics.
Same goes for traffic. It’s easy to buy hundreds of junk views for pennies even though they’re completely useless. You’ll see plenty of these gigs on Fiverr:

The best solution is to pick difficult to manipulate metrics, like profit, and to not judge your team members solely on metrics. Metrics should primarily be used as feedback that guides how you spend your effort.
However, if you do decide to incorporate metrics into performance evaluations, you need to know how to track them accurately.
For example, if you’re looking at social shares, you need to specify a certain expectation. You could say that only one social share per social account counts towards the metric and that the account needs to have at least 50 followers.
To track something like this, you will have to create your own simple tracking system.
For views, you might only count the ones that don’t bounce or are from certain countries. If you suspect fake views might be a problem, you probably wouldn’t want to count traffic from countries like India, which is often used for view bot IP addresses.
5. Metrics don’t always lie, but they can easily be misinterpreted
Metrics are important, but they have to be recorded and interpreted correctly, or you’re at risk of making big mistakes.
All marketers and business owners should have at least a basic understanding of statistics.
If you don’t have any background in statistics, sign up for this free “Introduction to statistics” course online. There are many other similar courses offered by top universities, so take advantage of them.
Most importantly, you need to understand concepts such as variance.
Variance measures how far results can deviate from the average expected result.
For example, you might use a specific email outreach template and track the number of backlinks it generates for your content.
Let’s say you get five links from the first 100 emails you send.
Does that mean that you’ll get five for every 100 emails you send from now on?
Not at all.
Depending on how big the variance is, sometimes you might only get one link, and other times you might get 10 links.
Imagine that the first time you sent 100 emails, knowing that you’d judge the results based on your links metric, you only got one link. If you judged your results right away, you’d say that this email template sucks.
But as you send more and more emails, your link percentage would rise to the average expected value.
In other words, you need to have a valid sample size before you interpret results; otherwise, they mean nothing.
When you go through an introductory stats course, you’ll learn about variance along with sample size and other related concepts.
The main takeaway here is to first learn about basic statistics and then to ensure that your metrics are accurate before you take them into account.
Conclusion
You should rarely make decisions concerning your business or marketing based on gut feeling alone.
Metrics give you confidence to make decisions because you know that you have numbers to back you up.
However, it’s crucial that you choose the right metrics and know how to track and understand them correctly. If you don’t, you’ll end up drawing incorrect conclusions, which are bad for your marketing and business as a whole.
I’ve shown you the 5 main ways that metrics can play tricks on you as well as ways to avoid making the wrong decisions based on them.
If you have any questions about using metrics in your work, I’d like to help out. Leave me a comment below with as many details about your business and the metrics you use as possible, and I’ll try to provide some insight.
